Understanding Observability: key components and benefits

This article is part 1 of a series on Observability:
- Understanding Observability: key components and benefits
- Metrics: Measuring System Performance with Metrics
- Understanding your Ps (percentiles, P95, P90, P50)
- Capturing System Events with Logs
- Understanding Request Flow from Traces
- Correlation and Context: Making Sense of Data
- Instrumentation: Collecting Data
- Visualization in Monitoring and Observability
The Power of Observability
In the so dynamic world of modern technology, maintaining the health and performance of digital systems is quite important for businesses looking to meet user expectations and stay competitive. At the heart of this task, we have the concept of observability—a fundamental principle that allows organizations to gain deep insights into the inner workings of their systems.
What is Observability?
Observability refers to the ability to infer a system's internal state and behaviour based on its external outputs or signals. It's about understanding what is happening inside a complex system by observing its external behaviour. This goes beyond various concepts such as monitoring metrics, logs, traces, and events to gain a comprehensive understanding of your system performance, reliability, and behaviour.
Monitoring vs. Observability: Understanding the Difference
Monitoring and observability are often used interchangeably, but they represent distinct approaches to understanding system behaviour, each with its own set of capabilities and limitations.
Monitoring: A Snapshot of System Health
Monitoring is the practice of collecting and analyzing predefined metrics and logs to track the health and performance of systems. It provides a snapshot of the system state at a given moment, allowing teams to monitor key performance indicators (KPIs) such as CPU usage, memory utilization, network traffic, and response time.
Monitoring tools rely on predefined thresholds and alerts to notify teams of potential issues or deviations from expected behaviour. For example, a monitoring tool might trigger an alert if CPU usage exceeds a certain threshold or if the response time for a critical endpoint exceeds a specified limit.

While monitoring is valuable for detecting known issues and tracking system health, it has limitations when diagnosing complex problems or understanding the underlying causes of problems. Without context or visibility into system interactions, monitoring tools may struggle to identify performance bottlenecks, detect anomalies, or pinpoint the root cause of problems.
Observability: Gaining Deep Insights into System Behavior
Observability, on the other hand, goes beyond traditional monitoring by emphasizing the ability to understand system behaviour from external outputs or signals. It encompasses a broader set of data sources, including metrics, logs, traces, and events, to provide comprehensive insights into system performance, reliability, and behaviour.
Unlike monitoring, which focuses on predefined metrics and thresholds, observability is about asking questions and exploring data to gain deeper insights into how systems operate. Observability tools enable teams to correlate data from multiple sources, analyze trends over time, and identify patterns or anomalies that may indicate underlying issues or opportunities for optimization.
For example, consider an e-commerce platform experiencing a sudden increase in checkout failures. While monitoring tools may alert teams to the rise in error rates, observability tools can provide additional context by correlating error logs with user session data, network traffic, and database queries. This holistic view enables teams to diagnose the root cause of the issue, such as a database bottleneck or payment gateway integration error, and take appropriate action to resolve it.
The Three Pillars of Observability
Picture observability as a three-legged stool – logs, metrics, and traces – each leg supporting a crucial aspect of understanding your system's behaviour. Together, they give you a wide view of what's happening under the hood. Considering them as pillars has always been a matter of debate between engineers. More would mark them as lenses. Let's take a closer look at each of them and see how they work together to keep your systems running smoothly.
- Logs: Logs provide a record of events and activities within a system. They capture error messages, warnings, debug statements, and other relevant data generated by applications, services, or infrastructure components. Logs are essential for troubleshooting issues, conducting root cause analysis, and auditing a system's inner working behaviour.
- Metrics: Metrics are quantitative measurements that track the performance, health, and behaviour of a system over time. They include key performance indicators (KPIs) such as CPU usage, memory utilization, disk I/O, network traffic, response time, and error rates. Metrics provide valuable insights into system performance, resource utilization, and user experience, enabling organizations to monitor, analyze, and optimize system behaviour. These metrics can be organized into infrastructure metrics (CPU Usage, disk I/O, ...), performance metrics (response time, request rate, ...), and business metrics. The latter is used to track the business goals. For an e-commerce website, that would be the number of users or orders. A significant drop in those metrics usually signals an issue in the system.
- Traces: Traces provide a detailed view of transactions or requests as they flow through a distributed system. They capture information about the journey of a request across multiple services, including service-to-service communication, latency, dependencies, and error propagation. Traces are essential for understanding the end-to-end behaviour of complex systems, identifying performance bottlenecks, and optimizing system architecture for better reliability and performance.
These three pillars—logs, metrics, and traces—work together to provide comprehensive observability of modern software systems' behaviour, performance, and reliability. By collecting, analyzing, and correlating data from these pillars, organizations can gain deep insights into their systems, diagnose issues more accurately, and optimize performance for better user experiences and operational efficiency.
Why Observability Matters
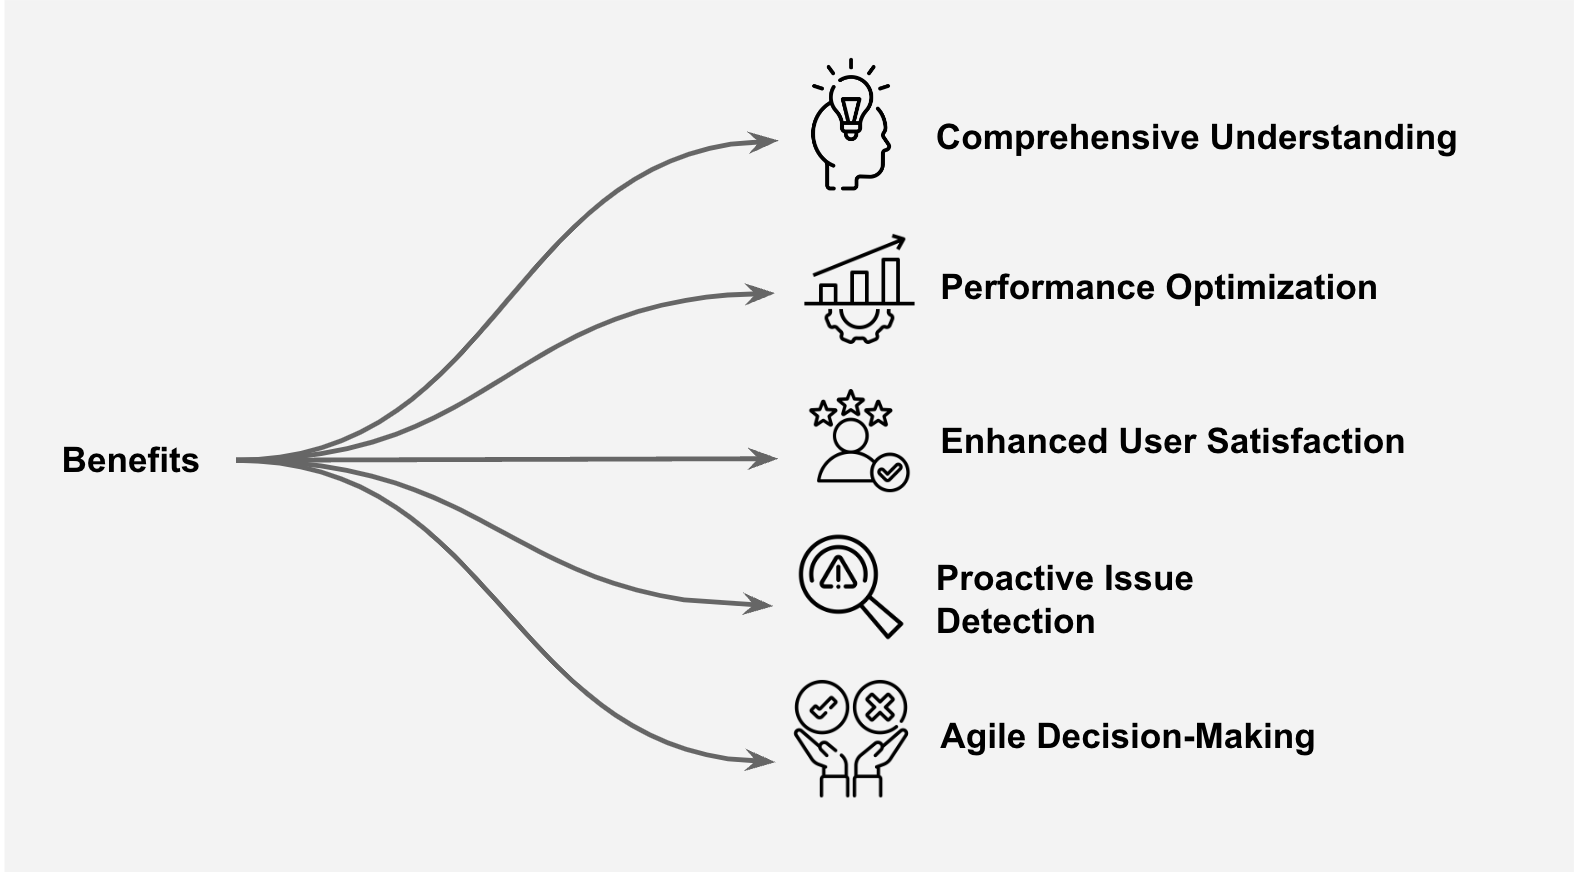
Observability is essential for modern software development and operations for several reasons:
- Comprehensive Understanding: Observability provides an understanding of system behaviour by correlating data from multiple sources. This holistic view enables teams to diagnose issues more accurately and respond more effectively.
- Proactive Issue Detection: By continuously observing system behaviour, observability allows teams to detect and address issues proactively before they impact users. Early detection minimizes downtime, reduces service disruptions, and enhances overall reliability.
- Root Cause Analysis: Observability tools provide valuable data and context for conducting thorough root cause analysis when incidents occur. This helps teams understand the underlying factors contributing to problems and implement effective long-term solutions.
- Improved Diagnostics and Troubleshooting: With comprehensive observability tools, teams can quickly diagnose and troubleshoot issues by analyzing real-time data and historical trends. This accelerates the resolution process, reduces mean time to resolution (MTTR), and enhances overall system reliability.
- Performance Optimization: With observability insights, organizations can identify bottlenecks, optimize system components, and improve overall performance to meet user demands efficiently. Fine-tuning based on observability data leads to enhanced user experiences and resource utilization.
- Agile Decision-Making: Observability empowers stakeholders with actionable insights and data-driven decision-making capabilities. By leveraging real-time analytics and visualization tools, organizations can make informed choices regarding resource allocation, capacity planning, and strategic investments.
- Enhanced User Satisfaction: A well-observed system translates to better user experiences. Organizations can foster customer satisfaction, loyalty, and trust in their products and services by maintaining high levels of performance, reliability, and responsiveness.

In essence, while monitoring provides valuable visibility into system health and performance, observability enables organizations to gain deep insights into system behaviour, diagnose complex issues, and optimize performance for better user experiences and operational efficiency.
Implementing Observability: Best Practices and Strategies
Implementing observability requires a combination of tools, processes, and cultural shifts within an organization. By following best practices and adopting effective strategies, teams can successfully implement observability practices to gain deep insights into their systems and improve overall performance and reliability.
1. Define Key Metrics and Data Sources
Start by identifying the key metrics and critical data sources for understanding system behaviour and performance. These may include metrics related to latency, throughput, error rates, resource utilization, and user interactions. Additionally, consider collecting data from various sources such as logs, traces, events, and external APIs to gain a comprehensive view of system behaviour.
2. Select Appropriate Tools and Technologies
Choose observability tools and technologies that align with your organization's needs and requirements. Look for solutions that offer capabilities for collecting, storing, analyzing, and visualizing data from diverse sources in real time. Popular observability tools include Prometheus, Grafana, Elasticsearch, Jaeger, and OpenTelemetry. Evaluate tools based on factors such as scalability, flexibility, ease of integration, and cost-effectiveness.
3. Instrument Your Applications and Infrastructure
Instrumentation is key to capturing relevant data and metrics from your applications and infrastructure. Embed observability libraries, agents, or SDKs into your codebase to collect telemetry data such as logs, traces, and metrics. Ensure that instrumentation is comprehensive and covers all critical components and services in your system architecture. We will be discussing this topic in a more large post.
4. Create Dashboards and Alerts
Build dashboards and visualization tools to monitor and analyze observability data in real time. Dashboards provide at-a-glance insights into system performance, while alerts notify teams of potential issues or anomalies. Configure alerts based on predefined thresholds or anomaly detection algorithms to proactively detect and address issues before they impact users.
5. Foster a Culture of Collaboration and Learning
Observability is not just about tools and technologies; it's also about fostering a culture of collaboration and learning within your organization. Encourage cross-functional teams to collaborate on observability initiatives and share insights and best practices. Invest in training and education programs to build observability skills and expertise across teams.
6. Continuously Iterate and Improve
Observability is an ongoing process that requires continuous iteration and improvement. Regularly review and refine your observability practices based on feedback from stakeholders, changing business requirements, and evolving technology trends. Experiment with new tools and techniques to enhance observability capabilities and drive continuous improvement in system performance and reliability.
7. Embrace Open Standards and Interoperability
Finally, embrace open standards and interoperability to ensure compatibility and flexibility across your observability stack. Adopt industry-standard protocols and formats such as OpenTelemetry, Prometheus, and Grafana to facilitate seamless integration and interoperability between different observability tools and components.
Wrapping up
In essence, observability is not just a technical concept; it's a strategic imperative for organizations seeking to grow in today's fast-paced digital landscape. By embracing observability practices and tools, businesses can unlock a wealth of benefits, including improved reliability, agility, and customer satisfaction.
